DATA COLLECTION
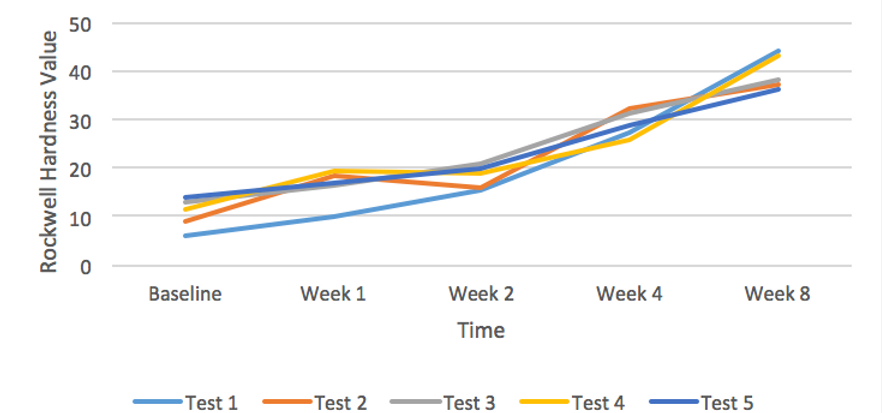
This chart shows the results of the rockwell hardness test. Each sample was tested 5 times for accuracy and comparison.

DATA INTERPRETATION
This chart shows a relationship between the rockwell hardness values and the amount of time each sample was exposed to water. The trend shows the hardness increases as the time in water increases. At the baseline, the mean value was around 10. After week eight, the value jumped to around 40.
DATA
Testing video
This short video shows the indentor pressing into the specimen and then withdrawing from the preliminary step.
TESTING
Designed Disk
Using the Autodesk Fusion 360, a sample was created and oriented on the print bed. Using the software and an Ultimaker 2+, the sample was then 3D printed. The specimen specifications are 76.2 x 76.2 x 6.4 mm.


Tested Samples
These specimens are pictured after testing. The non-elastic material shows the indentation marks. The 5 samples ranged from a baseline, one week, two weeks, four weeks, and eight weeks submerged in water. Each were tested five separate times with a couple of the marks on week four solely used to identify the correct standard.
Equipment Used
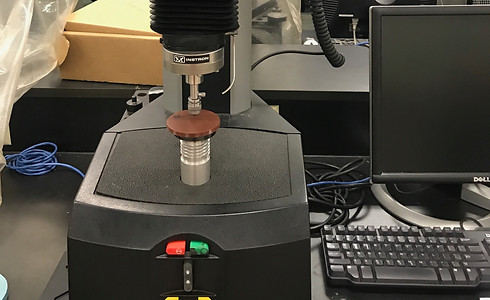
The Wilson Rockwell Series 2000 machine was used to test the specimens. Leslie Gregg assisted with this test inside of the Mechanical Engineering Technology testing labs.

A Rockwell Hardness test measures the hardness of a material. By measuring the permanent depth of the indentation, it determines the resistance to indentation. A steel ball of a chosen diameter places a preload on the material. This surface break reduces the effects of the surface finish. This creates a measured baseline depth. The major load is then added to reach the total required test load. The indenter then returns to the preliminary position to measure the final indentation.
